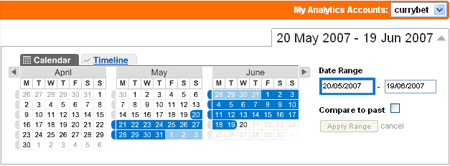
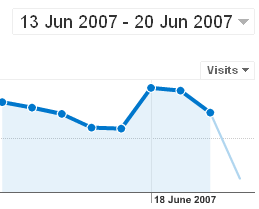
Quickly setting the default Google Analytics dashboard view to show a week or 48 hours
I love Google Analytics, it is a brilliant tool, and free, and the recently revamped user interface definitely improved the product. Of course, it is also another avenue for Skynet Google to find out everything about my online activities, but there you go.
The only problem I've had with the recent redesign, apart from how long the flash interface takes to download over Greek dial-up, is the initial date range it loads.
Despite the dashboard interface being customisable in all sorts of ways, try as I might, I have not been able to find out how to set the default Google Analytics dashboard date range to anything other than a month.

Looking at a months figures is useful to see general trends, or if you only occasionally dip in to analyse your traffic. However for a logfile stats nerd like, and for a blog which publishes every weekday, it is simply too long a period of time. I want to see what has been popular this week, what keywords are driving people to the site, and where the referrers are coming from for the last few articles I've published, not for a whole month.
A search did turn up this post on Digg, where user Wildfire had posted a link to a bit of javascript code that can be bookmarked to change your dashboard view to the last 7 days.
This was almost exactly what I was looking for, but only almost.
Because Wildfire's script snippet includes today as one of the 7 days, it means that the reports include as a whole day a period of time when Analytics hasn't processed a full 24 hours worth of data.
And nobody wants to see depressing graphs which are always dipping on the right-hand side, simply because the data hasn't been collected.
I've therefore made two tweaks to the javascript to produce bookmarks which give me the date-ranges I need. One is a 7 day period from yesterday to 8 days ago. That gives you a weekly view of your Google Analytics dashboard data without including incomplete data from today.
The second sets the dashboard date range to be today and yesterday. That gives a really quick snapshot of what has been happening on your site in the last 24 to 48 hours, depending on the time of the day you access the report.
To use them, you'll need to copy the javascript fragment into a text editor. Put your Google Analytics ID into them in the place where it says GOOGLE_ID. This number can be copied out of the URL you see when you are viewing your default dashboard in Analytics.
When you've put the correct number in, you can bookmark the script to get a one-click button on your links toolbar to switch the dashboard to the weekly or the 48 hour view.
Of course, I'd still rather Google introduced a feature that allowed you to specify a shorter default timescale for the opening view, but in the meantime these bookmarks make life a little easier.

Incidentally, if you do use Google Analytics, then this tweak to the code placed on your page will pass the full referring URL through to the reports, allowing you to dig a bit deeper than domain name level. Another invaluable time-saver.
I was trying your code for Google analytics, but the 'last week' code seems to create the wrong 'start date'. For some reason using it today throws up a URL of 20080396. It seems to add todays date to 100, and then minus 8 (ie: 100+4-8=96).
I'm no good at Javascript, and your code seems so close to working. Am I doing something wrong?
I used this code above as the basis for my own code to produce a few outputs. I did find this code didn't have any error management at all, so that was the majority of the problem. It took me 403 lines to sort it out. But i ended up with a really robust (if messy) piece of code in asp. If anybody wants the code which gives you 14 different links to your appropriate page just send me an e-mail at tcwadams@gmail.co.uk
Though it is MIGHTY messy as it is my first piece of programming ever.